

Gaither Dynamic at NAEH 2025: Bridging Connections and Innovations in Ending Homelessness
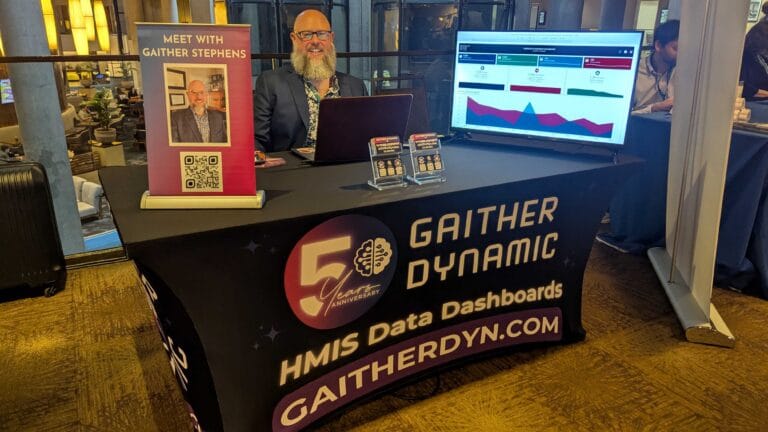
This February, Gaither Dynamic was proud to exhibit at the National Alliance to End Homelessness’s 2025 conference in Los Angeles, focusing on innovative solutions for ending unsheltered homelessness. We shared insights from our data-driven projects, engaged with fellow leaders, and renewed our commitment to transformative solutions. A personal highlight was reconnecting with my son, emphasizing the deep, personal stakes involved in our mission to bring people home.
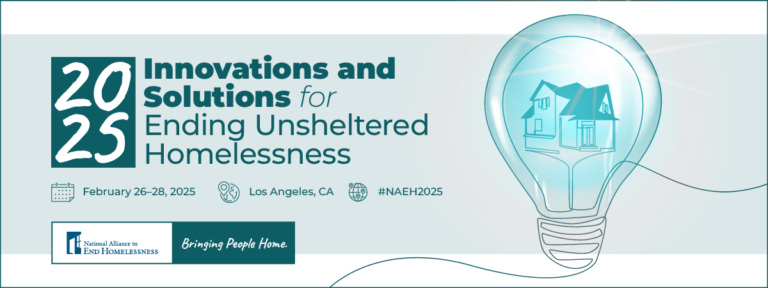
Join Gaither Dynamic at the NAEH’s 2025 Innovations and Solutions for Ending Unsheltered Homelessness Conference
Join Gaither Stephens, CEO of Gaither Dynamic, from February 26-28 at the NAEH 2025 conference, themed “Innovations and Solutions for Ending Unsheltered Homelessness.” Visit our booth to explore advanced data dashboards, discuss AI in social services, and learn about joining the CoC Alliance. Discover how we leverage data to enhance homeless services and look forward to connecting with like-minded professionals dedicated to making a difference. Don’t miss the chance to see our tools in action and gain insights that can transform your strategies!

Increase Capacity through AI Technology: An FCEH 2024 Presentation
Join Gaither Stephens, CEO of Gaither Dynamic and Founder of CoC Alliance, for a transformative presentation on harnessing the power of artificial intelligence to enhance social services. In this session, Gaither will explore both the potential and the pitfalls of AI in managing and extending limited resources within the social services sector.
Discover innovative strategies to:
Improve service allocation and operational efficiency.
Enhance data quality for better decision-making.
Navigate the challenges of AI implementation to avoid common pitfalls.
This free presentation will delve into the role of AI as an assistant, not an overlord, empowering social service professionals to provide better, more effective care. Don’t miss out on insights that could revolutionize your approach to resource management and impact your community positively.

