Homelessness fell for the first time in nearly a decade, and both sides rushed to claim it. The real story is stranger, and more useful: a migration surge receding and a quiet success no one is citing. Underneath both is a single fight, over whether to keep funding Housing First, that the new federal rules are trying to end.
The short version
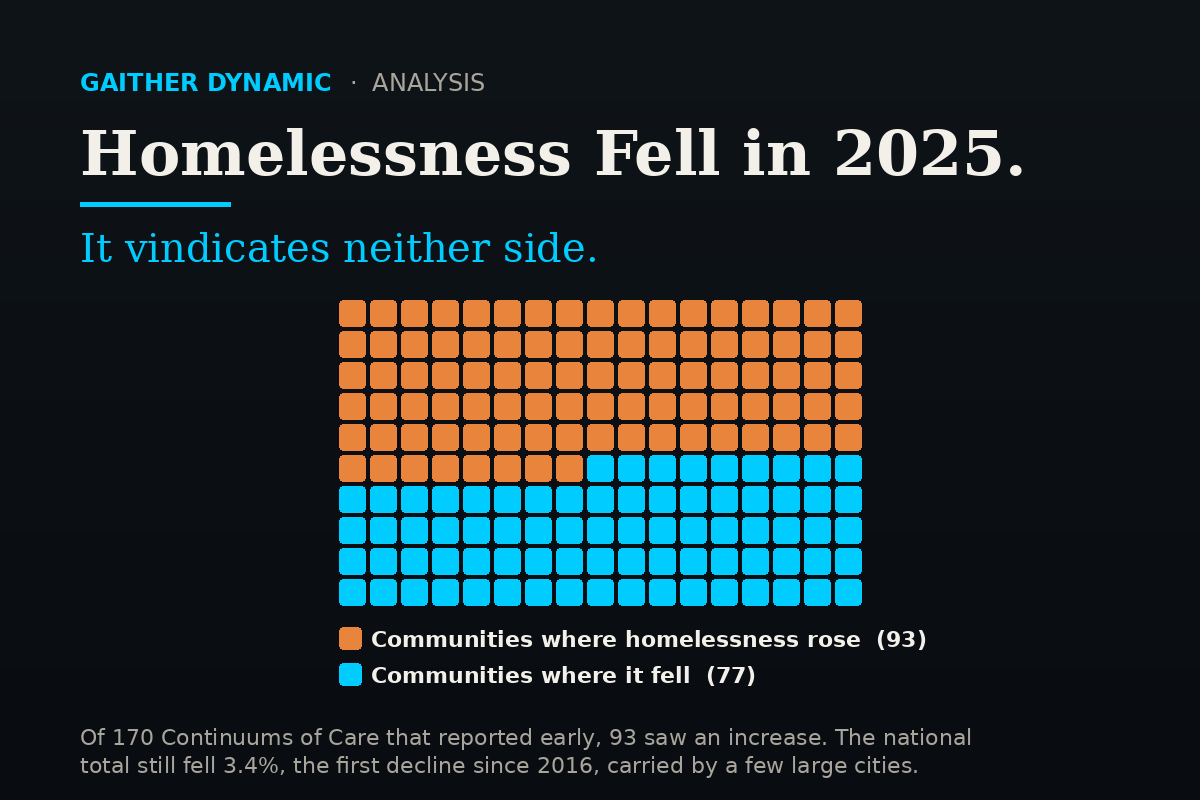
- The count fell, but most places got worse. National homelessness dropped 3.4 percent, the first decline since 2016. Yet of 170 communities that reported early, 93 saw it rise.
- The drop was a few big cities, not a policy win. It came almost entirely from family homelessness, mostly in a handful of large metros where a 2024 migrant-shelter surge was receding.
- The clearest durable national success is veterans. Down more than half since 2010, across fifteen years of funded housing and services under both parties. That is Housing First, fully paid for.
- HUD is defunding that exact approach. The new FY2026 rules declare Housing First a failure and drop it from scoring, hitting the chronically homeless hardest, just as their numbers reach a record.
- The courts are already involved. On June 29, a federal judge struck down the prior version of these rules as unlawful. HUD can appeal.
- The bottom line. Much of the available evidence and the new rules point in different directions, and local programs must compete under them by the August 26 deadline.
Every January, in the cold and usually after dark, volunteers spread out across the country to do something strange: count the homeless. They walk the streets, check the shelters, and tally every person without a home on a single night. Officially, it is the Point-in-Time count, and for nine years running its total went up. This year it went down, to 745,652 people, about 3.4 percent fewer than the record set in 2024, and the first drop since 2016.
It arrived in the same few weeks that HUD, the federal housing agency, rewrote the rules for how it funds the country’s response to homelessness. So everyone wanted to know the same thing: did something finally work? Two camps answered yes, in opposite directions. One says the response system turned a corner. The other says a tougher federal approach is paying off.
The honest answer is that neither is true, at least not the way they mean it. Look closely, and most of the “decline” isn’t really progress. It is a handful of big cities coming down off a one-time surge, and, buried deeper in the data, one genuine success story almost no one is citing, because it argues against the very rules HUD just wrote.
Underneath both camps sits the same older argument: whether to keep funding Housing First, the policy of giving people a home first and not requiring sobriety or treatment in return. The 2025 numbers do not settle it. The new federal rules try to settle it anyway.
A quick word on the numbers. The national figures are HUD’s official 2025 count, released in May 2026. The community-by-community patterns come from Community Solutions, a nonprofit that gathered early local counts from 170 areas. The funding estimates come from the nonpartisan National Alliance to End Homelessness. Where a claim leans on a single source or on my own inference, I flag it.
What the count found
The drop was real, but it came almost entirely from families. Single adults and the chronically homeless both hit new records.
The decline showed up in both kinds of homelessness. Sheltered homelessness, people staying in shelters or transitional housing, fell about 4 percent, roughly 17,000 fewer people. Unsheltered homelessness, people sleeping outside or in cars, fell about 3 percent, roughly 8,000 fewer. About two-thirds of everyone counted was under some kind of roof.
| Group | January 2025 | Year-over-year |
|---|---|---|
| Total | 745,652 | down about 3.4% (roughly 26,000 fewer); first decline since 2016 |
| People in families | 230,366 | down about 11% (nearly 30,000 fewer) |
| Individuals, not in families | 515,286 | up 0.6%, highest on record |
| Veterans | 32,495 | down 1.2%, lowest on record |
| Chronic homelessness, total | 155,750 | up, highest on record |
| Unsheltered chronic | 96,711 | first decline since 2018 |
But one number reorganizes the whole picture. Almost the entire national decline came from a single group: families. Family homelessness fell by nearly 30,000 in one year, which is actually larger than the net national drop of about 26,000. How can the part be bigger than the whole? Because while families were leaving, single adults were arriving. The count of homeless single adults hit a record, and so did chronic homelessness. By definition, that term means two things at once: homeless a long time, and living with a disability. These are not simply the people who have been homeless longest; they are the ones carrying it with the least to fall back on. So the system got better at one thing, moving families through shelters, and worse at the hardest thing, the people stuck on the street for years. Hold onto that split. It is the first sign that the headline hides more than it tells.
What moved: 2024 to 2025
Where the decline came from
Among the communities that reported early, most actually got worse. The national decline came from a few big cities, mostly a migration surge receding.
If a national policy were working, you would expect improvement across the country. You don’t. Of the 170 communities with early 2025 counts, 93 saw homelessness rise. Big cities fell about 4 percent; rural areas rose about 3 percent and suburbs about 1 percent. The national number dropped only because a few very large places fell far enough to pull the average down with them. In other words, the “national decline” is really a local story, and not one most communities can copy.
Among early reporters, most got worse
Which big cities, and how they compare
Homeless people per 10,000 residents (2025).
In those big cities, a major driver appears to have been the migrant shelter surge, and HUD’s own data points in that direction. In 2024, family homelessness jumped 39 percent nationwide, but almost all of it was in a handful of places: in the 13 communities that reported a migration impact, family homelessness more than doubled, against under 8 percent everywhere else. In New York City, newly arrived migrant and asylum-seeking families accounted for 88 percent of the rise in sheltered homelessness.
Where the 2024 family spike landed
That is a strong inference, not a settled fact, and it has limits. HUD has not released a count that separates migrants from everyone else, so no one can prove the exact split. And the surge was almost entirely in shelters, so it explains little about why unsheltered homelessness fell by 8,000, or why veterans kept improving. (One libertarian estimate credits New York and Illinois alone for most of the national drop; it is a single, advocacy-aligned figure, but it points the same way as HUD’s community data.)
There is also a quieter possibility: the count may simply have missed people. Chicago’s 2025 report warns that some immigrants avoided being counted out of fear of enforcement, and after the Supreme Court’s 2024 Grants Pass v. Johnson decision, several cities cleared encampments, pushing unsheltered people out of sight. Neither has been measured, but both lower the number without housing anyone.
Did immigration drive the decline? Partly. But only partly. The family drop in a few big cities, yes. The whole national decline, no: the fall in unsheltered homelessness and the fall among veterans have nothing to do with a migrant-shelter surge that was almost entirely sheltered and packed into a few places. Immigration explains one real, specific piece. It is not proof that a crackdown ended homelessness.
A drop carried by a handful of big jurisdictions is not the signature of a national policy working.
The strongest durable signal
The clearest decline that survives scrutiny is veterans, and it points the opposite way from the rules HUD just wrote.
Now the success story almost no one mentions. One decline in the 2025 count holds up no matter how hard you push on it, and it is the best evidence this field has. It is veterans.
Veteran homelessness fell again, to 32,495, the lowest figure ever recorded. The single year isn’t the point. The number has dropped by more than half since 2010, steadily, through good housing markets and bad, under presidents of both parties. It did not fall because of a migration blip or a quirk in the count. The explanation with the most evidence behind it is the simplest one: the country decided to actually fund the fix for one group and stuck with it. That meant housing vouchers paired with case workers, money for prevention and rapid re-housing, and the VA tying the pieces together. The federal budget for veteran homelessness grew from about $376 million in 2009 to roughly $3 billion today.
Veteran homelessness, 2010 to 2025
This is about as close to a controlled experiment as this field gets. It has everything the 2025 headline lacks: a long track record, steady funding, and a result that lasted instead of flickering for a single year. And here is the part that matters for today’s fight. The veteran system is broadly consistent with Housing First, the approach of giving someone a home first, without requiring them to get sober or finish treatment as a precondition. The biggest, longest real-world test of Housing First in America is the veteran program, and over fifteen years it cut the number by more than half. Put plainly: one of the strongest bodies of real-world evidence we have for reducing homelessness is the fully funded veteran system, which broadly follows Housing First principles, the same approach HUD is now stepping away from.
The country cut veteran homelessness by more than half. It did it by funding the fix and sticking with it.
It is evidence, not proof, and the difference matters. Veterans aren’t a random sample of homeless Americans. They are mostly single adults, they have their own federal health system, and they had a rare political consensus behind them that unlocked money no other group ever got. So the veteran result doesn’t prove the same model would do the same for everyone else. But it is the strongest signal we have, and it points the opposite way from the new scoring framework.
HUD’s case, stated fairly
HUD's case is strongest exactly where the system is weakest. It deserves a real hearing before it gets an answer.
HUD's argument
Single-adult and chronic homelessness are at record highs. For them, housing placement alone has not produced recovery, so money should follow treatment, earned income, and measurable exits to unsubsidized housing.
The rebuttal
The one durable, multi-year success is veterans, where the model was actually funded. That is not proof it failed elsewhere. For most of the system, it was never funded at anything close to the veteran scale.
If the best evidence points away from the new rules, then the case for them had better be strong. And in one respect, it is. It would be easy to wave the new direction away as evidence-free. It isn’t. Here is HUD’s case at full strength, then the answer.
HUD’s evidence
Single adults and the chronically homeless are at record highs, and they are the group most likely to be dealing with serious mental illness or addiction. For them, HUD says, simply handing over an apartment hasn’t produced recovery, and its own numbers are stark. Among people in HUD-funded housing, only about 6 percent earned more from work over a year, while a third gained income from benefits. In permanent supportive housing, the long-term housing-plus-services model, only 13 percent of households left in a year, and barely 1.7 percent moved on to housing they paid for themselves. Nearly twice as many left because they died.
HUD makes a blunter point too. Since Housing First became the federal default in 2013, homelessness is up 27 percent, unsheltered homelessness up 36 percent, and chronic homelessness up 81 percent, even as permanent-housing beds grew 151 percent and program funding grew 111 percent. Those are HUD’s own figures, and they describe a system that, for its hardest cases, has come to look more like permanent housing than a path out of it.
HUD's own outcome numbers
Where it holds up
On the narrow point, HUD is right. Housing alone has not produced recovery for the chronically homeless. The numbers above are real. And a competition that renews the same providers every year, regardless of results, has grown complacent. Anyone defending the current system has to start by admitting that.
Where it breaks
The trouble is the conclusion. Blaming Housing First for the rise is the shaky part. The same years saw the supply of affordable rentals collapse, and the most careful research finds that what drives homelessness rates, place to place, is mostly the housing market, not which response model a city picked. Beds going up while more people lose their homes faster isn’t proof the beds failed. It is a sign the flood is outrunning the buckets.
And the aim is off. HUD’s evidence is about chronic and single-adult homelessness, where progress has always been hardest and the money thinnest. Then it applies the cure to the whole system, including the family and permanent-housing programs that were never the problem. For families, the 2025 drop was most likely migration. For veterans, where the model is actually paid for, it is delivering the only durable win the field has.
"The model doesn't work" and "the model was never funded enough to work" are two completely different claims.
That distinction is the heart of the whole fight, and HUD’s own data does not settle it in HUD’s favor.
Where HUD drew the line
HUD cut the protected share of existing grants from 90 to 60 percent, putting tens of thousands of occupied homes into open competition.
That is the argument over whether the old approach failed. Here is what HUD did with it. On June 1 it published the rules for this year’s $4.04 billion competition, the annual process, known as the NOFO, that decides which local homelessness programs get federal money. Applications are due August 26. The big change is a single dial. For more than a decade, about 90 percent of a community’s existing grants sat in a protected tier that renewed almost automatically. HUD cut that protected share to 60 percent and threw the other 40 percent open to compete on score. And it didn’t hide its reasoning, stating in the document that “‘Housing First’ has been a profound failure by any measure” and dropping Housing First from how applications are scored.
The National Alliance to End Homelessness ran the math on that one change. It estimates at least 97,000 people in federally funded permanent housing are now at risk of losing it, and describes that as a conservative figure. It puts the money pulled out from under permanent housing at $1.23 billion or more. A separate cap on funding for new projects would, by its estimate, strip about $93 million from a group of high-need communities that together hold 43 percent of the nation’s homeless population.
The protected tier shrinks
HUD rejects the word “cut.” Its FAQ says flatly that “no funding has been cut,” and that there is “more funding available than ever before.” The competition total has indeed grown three years running, from about $3.67 billion to $3.92 billion to $4.04 billion. Both things are true, because they measure different things. The total grew. What shrank is the safety of the grants inside it. Moving that 30 points out of the protected tier means a program that exists today is no longer nearly guaranteed to be renewed, even as the headline number ticks up. HUD expects some permanent-housing providers to convert into transitional housing through a “Transition Grant”; HUD frames that as rebalancing, and critics see it as defunding by another name. The fair summary is narrow: the total dollars are flat to slightly up, and the protected share for existing permanent housing is down. Whether that is a “cut” depends on whether you are counting dollars in the program or beds for actual people.
The pot grew while protection shrank
The scoring was rebuilt to reward treatment and recovery, earned income, moving people into housing they pay for themselves, and reducing encampments, and to require communities to certify they don’t run drug “consumption sites.” (The fine print clarifies this doesn’t force sobriety or evict anyone for a single relapse.) A new bonus rewards building in a federal Opportunity Zone, a tax-incentive map of designated neighborhoods. The spending bill also let projects give preference to the elderly and people with disabilities, and the standard for inspecting units changes in October. One warning belongs on any plan: the money being redistributed comes hardest out of the big, high-homelessness cities, the same places whose counts swing the most because of the migration surge and its retreat.
Alongside all this, HUD opened a faster, separate door. A new program named CoC Builds, posted June 23, offers $100 million in one-time grants to actually build new permanent supportive housing, with applications due July 23. It expects about eight awards, up to $12 million each, with a portion reserved for smaller states. The contradiction is worth saying out loud: HUD is paying to build permanent supportive housing through one program while cutting the points for it in the other.
The message isn't "no more permanent housing." It is: build the buildings, but fight for the operating money on new terms.
Why this argument can’t wait
Chronic homelessness just hit a record, and the chronically homeless are the group Housing First was built for. Pulling it now, for them, is the overhaul's biggest gamble.
Here is why the line drawn this summer matters more than an ordinary funding fight. Chronic homelessness, long-term homelessness paired with a disabling condition, just reached its highest level on record. And the chronically homeless are not a footnote in the Housing First story. They are the group it was designed for, more than thirty years ago, and the same group HUD now holds up as its central failure.
Both can be true at once. Housing First keeps these clients housed at rates treatment-first programs have never matched: in Canada’s At Home/Chez Soi study, the largest randomized trial the field has run, roughly 85 percent of high-need participants stayed stably housed, against about 60 percent in usual care. That is its strongest result, and the reason it became the standard. It is weakest at exactly what HUD measures: moving them into work and off assistance. So for this group the real choice is between a model that reliably keeps the hardest cases alive and indoors, and a bet that something less tested will do more.
What makes the timing risky is the fallback. HUD’s answer for this group is treatment and earned income, and where that delivers, good. But if the housing money is pulled and the replacement underperforms, communities are left with one other lever for the people still on the street, the one the 2024 Grants Pass decision just made easier to use and the new rules reward: clearing them. A 2025 executive order, “Ending Crime and Disorder on America’s Streets,” pushes the same way, directing officials to clear encampments and making it easier to commit people involuntarily. Supporters frame the commitment piece as a way to get severely ill people into care; critics see criminalization by another name. No one can promise chronic homelessness will surge. But it is already at a record, the tool with the best evidence is being defunded for exactly this group, and the readiest substitute is enforcement. That is a heavy bet to place in a single season.
What is unusual about the process
Set the policy debate aside. The process itself is unusual, no matter where you stand.
Several features make the competition harder to run, and harder to trust.
A decade of policy changed on a stopwatch. A rewrite this big, undoing a framework that stood for more than ten years, dropped June 1 with everything due August 26, far less runway than a change this size normally gets.
A judge just struck down the prior version of these rules. On June 29, 2026, a federal court in Rhode Island granted summary judgment and vacated HUD’s November and December 2025 NOFOs, the direct predecessors of this one, in a case brought by a coalition of states and homelessness nonprofits. The court found HUD acted arbitrarily by scrapping Housing First without weighing the disruption to grantees and the people they serve. In its own words, HUD’s attempt to “hastily eliminate its Housing First approach” was “the hallmark of unreasoned decision making.” The court separately held that HUD exceeded its authority by missing the statutory deadline to issue a NOFO within three months of the appropriation. It let HUD try again rather than bar it outright, but when the plaintiffs moved to fold this June 2026 NOFO into the case, it pointed them to a separate suit. HUD can appeal to the First Circuit, where this fight has already been once, so this is not the final word. But as it stands, the approach behind this competition has been held unlawful in its earlier form, and a direct challenge to this version is openly anticipated.
The deadline started before the tools to meet it existed. By many accounts from the field, the application system was not open, the official question inbox went unanswered, and the update list was throwing errors while the August 26 clock ran. Not officially confirmed, but widespread and consistent.
It grades you on a line that’s about to move. The rules give bonus points for building in an Opportunity Zone, but a new Opportunity Zone map takes effect January 1, 2027 and the current zones expire by 2028, the exact years these projects would be built. The boundaries will shift under the applicants chasing them.
The construction window is absurdly short. CoC Builds gives roughly 30 days to assemble an application that requires site control and matching money, for grants up to $12 million. Thirty days is almost nothing for a real-estate deal that size.
The competition now reaches housing people already live in. Pulling that 30 percent out of the protected tier puts existing, occupied permanent housing into the contest, mid-stream. That is what the 97,000 figure is really about.
None of this requires assuming bad intent. Every item is a documented fact about how the competition has been run, and every one is a reason the field is struggling to run it cleanly, separate from whether the policy behind it is right.
What this leaves for the people who run the system
Whoever wins the argument, local programs have to compete now, under rules that point away from their own best evidence.
The argument over who’s right will be settled, if it ever is, in court and in Congress. The people who actually run local homelessness systems, the Continuums of Care (CoCs), don’t get to wait for that. They didn’t write the rules, they can’t outlast the lawsuits, and their applications are due in August. They have to compete, hard, under a scoring system that points away from the best evidence in their own data.
That 97,000 figure is homes with someone living in them.
How a community ranks its own projects this summer will help decide which of those homes survive. At HUD’s June 25 information session and in the forums around it, the people who run these systems kept asking questions the guidance still hasn’t answered: can a services-only project pay for diversion, how exactly do you report someone who returns to homelessness, and why is HUD pushing toward transitional housing without national data showing it beats what it would replace? The common complaint was that HUD’s sessions recited the rules instead of explaining them.
So the near-term job is triage. The single most valuable hour a community can spend this month is re-running its own project rankings as if only 60 percent were protected, to see which grants now have to win on merit instead of coasting. The build-it decision is even more urgent, with its late-July deadline and one shot per community. The slower work is in the data: tracking earned income, cleanly separating the people who moved into housing they pay for from those who didn’t, reporting returns, and finding a defensible source for encampment numbers, all things that now earn points and that most data systems were never built to capture. And one discipline matters more than any single metric: don’t let the national headline write your local story. A rural or suburban community most likely saw homelessness rise, and its application should rest on its own data and its own latest count, not on a national trend it never lived.
The bottom line
Read honestly, 2025 makes everyone give a little ground. The count fell for the first time in nearly a decade, and that is real progress. But most communities never felt it: of the 170 that reported early, 93 went up. The evidence suggests the biggest single driver of the national drop was the unwinding of a one-time migrant shelter surge in a handful of large cities, rather than a nationwide policy change. The only durable success story is still veterans, the one place the country paid for housing and services and held the line. And the people the new rules are aimed at, single adults and the chronically homeless, kept doing worse.
So the field inherits a contradiction. Much of the available evidence points toward funding housing and services. The competition everyone now has to win is built on a different theory of what should be rewarded than much of the existing evidence suggests, with tens of thousands of homes, and the country’s hardest cases, riding on the next few months.
The 2025 count doesn’t prove Housing First succeeded. It doesn’t prove Housing First failed. It answered one question, that the decline was real, and left the harder ones untouched: how much of it any policy produced, and which policies will survive once the migrant surge has fully receded. The first count that can answer those arrives in 2026, taken after both the retreat and the new rules have fully landed. Until then, the honest move is to hold 2025 loosely. The people who house people don’t get that luxury. They have to compete now, with the data they have, under rules the 2025 evidence hasn’t yet earned.
Work with the data before you write your application
The NOFO deadline comes once a year. The data work is the other fifty-one weeks. Gaither Dynamic builds CoC and HMIS data dashboards for exactly the question this competition forces: where do your numbers sit, and where are they heading, before you argue your case.
The Community Snapshot Dashboard turns at least a year of your HMIS data into a view you can filter by date, demographics, and project, and track over time. Or get the monthly newsletter for more on the NOFO, HMIS, and measurement.
Gaither Stephens is the CEO of Gaither Dynamic, founder of the CoC Alliance, and director of Gaither Research. Disclosure: Gaither Dynamic sells data and analysis services to Continuums of Care, the entities whose funding this article discusses.
Methodology and disclosures
How the numbers were sourced. The national figures are HUD’s official 2025 Annual Homelessness Assessment Report (AHAR) Part 1, released in May 2026, with year-over-year changes measured against the 2024 AHAR. The community-by-community pattern, 93 of 170, comes from Community Solutions’ aggregation of early 2025 counts. The city figures in the interactive chart are HUD’s official 2007 to 2025 Point-in-Time counts by Continuum of Care, and the per-capita rates are computed against U.S. Census Bureau 2024 population estimates. Funding-impact estimates are the nonpartisan National Alliance to End Homelessness’s. HUD’s own outcome figures and the competition totals come from the FY2026 CoC NOFO and its June 2026 FAQ. The court findings and the quoted language are taken directly from the June 29, 2026 memorandum and order, not from secondary coverage. Every figure was checked against its primary source, and where a claim rests on a single source or on my own inference, it is labeled that way in the text. The full source list is below.
Caveats carried in the text. A few numbers come with documented limits, flagged where they appear. The 2025 family decline is most plausibly tied to a receding migration surge rather than to any single policy, and that is an inference, not a proven decomposition. Some city-level changes reflect data-collection artifacts: Chicago’s inflated 2024 base, Seattle’s sheltered-only 2025 count, and Denver’s regional geography. And per-capita rates are rough across communities, because Continuum of Care boundaries and counting methods differ.
A note on how this was made. I used AI tools to help research primary documents, produce early drafts, and build the interactive graphics. Every factual claim, quotation, interpretation, and editorial conclusion was reviewed by me before publication. I verified every figure and quotation against its original source, and I take responsibility for the analysis and for any errors that remain. If you find one, please let me know and I will correct it.
Sources
- HUD, 2025 AHAR Part 1 (January 2025 count), released May 29, 2026: huduser.gov
- HUD, 2024 AHAR Part 1 (family homelessness and migration concentration): huduser.gov
- NLIHC summary of the 2025 AHAR: nlihc.org
- Community Solutions, 2025 Homelessness Estimates (93 of 170 communities rose): community.solutions
- NPR, on the 2024 AHAR and migration (NYC 88% of sheltered increase; mid-2024 asylum limits): npr.org
- Independent Institute, “Homelessness Count Fell in 2025, but Are the Numbers Reliable?” A libertarian think tank, cited only as a cautious secondary estimate: independent.org
- HUD, FY2026 CoC NOFO (CPD-2600-DC-0025): primary text for the Housing First statement, Tier 1 at 60 percent, and HUD’s earned-income and PSH-exit figures
- HUD, FY2026 CoC NOFO FAQ (June 12, 2026): HUD’s defense, the FY2024 to FY2026 totals, the since-2013 trend figures
- NAEH, “Changes to HUD Policy Threaten Efforts to End Homelessness” (97,000 at risk; $1.23B): endhomelessness.org
- CoC Builds NOFO (CPD-2600-DC-025A), posted June 23, 2026
- U.S. District Court for the District of Rhode Island, Memorandum and Order, June 29, 2026, in State of Washington v. HUD (No. 25-cv-626) and National Alliance to End Homelessness v. HUD (No. 25-cv-636): summary judgment vacating HUD’s November and December 2025 NOFOs under the APA, denying a permanent injunction, and declining to add the June 2026 NOFO to the case while noting plaintiffs may challenge it separately
- HUD, 2007 to 2025 Point-in-Time Estimates by CoC (the city-level counts behind the interactive chart, and the basis for the per-10,000 rates when paired with Census 2024 population): huduser.gov
- Executive Order 14321, “Ending Crime and Disorder on America’s Streets” (July 24, 2025), on encampment removal and involuntary commitment: npr.org
- At Home/Chez Soi, the largest randomized trial of Housing First (Canada; about 85 percent of high-need participants stably housed versus 60 percent in usual care): psychiatryonline.org