Race-comparison analytics with z-test analysis
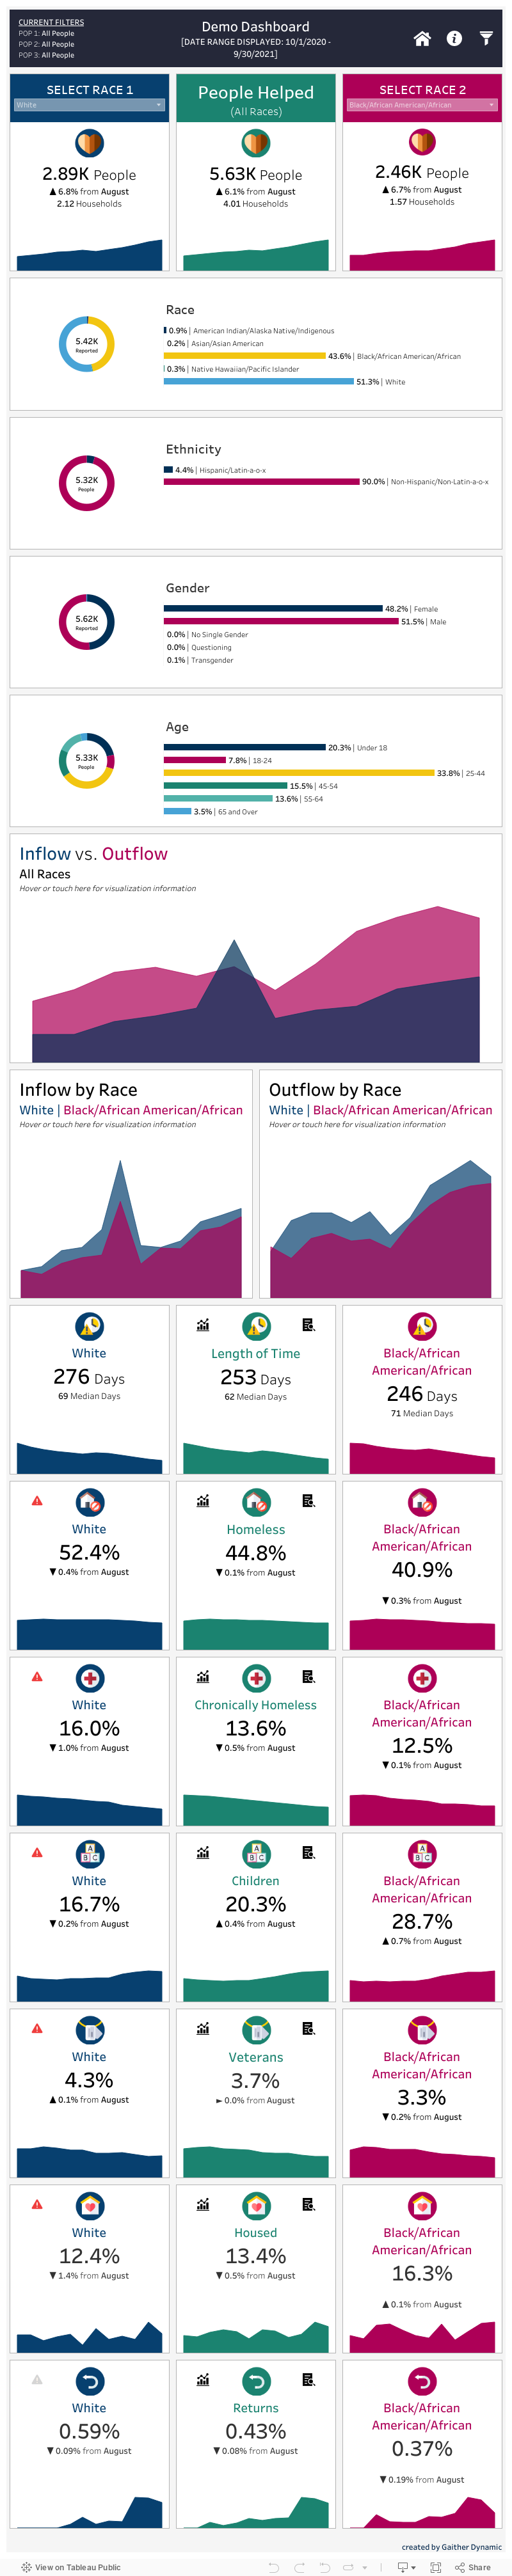
Community Equity Dashboard
Built from the same hashed HUD CSV export that powers CSD, the Community Equity Dashboard breaks the system out by race so you can pick any two populations to compare side by side. The dashboard runs a z-test on every key metric and surfaces a red hazard icon wherever the disparity is statistically significant. Click any flagged metric to drill into a deeper investigation page that goes beyond the front-page summary.
Interactive Demo
Try the live dashboard.
Real demo data. Pick two race categories on the left and right and let the dashboard tell you where the system has work to do.
What's inside the dashboard
- 1Pick any race on left and right; everything else recomputes
- 2z-test runs on every metric, red hazard icon means significant disparity
- 3Cuts: people experiencing homelessness, children, chronically homeless, veterans (housed and currently homeless)
- 4Investigative pages: click any icon to dig deeper than the front page
CED is built from hashed HUD CSV exports out of HMIS, the same file that powers CSD. Aligned with HUD 2026 HMIS Data Standards and compatible with all major HMIS vendors.
Ready to see CED on your data?
Send a hashed HUD CSV (zipped, usually a few MB). We'll run CED against it and walk you through every flagged disparity. No deck, no sales pressure.